Outdoor LED ROI: Calculating Payback for High-Traffic Screens
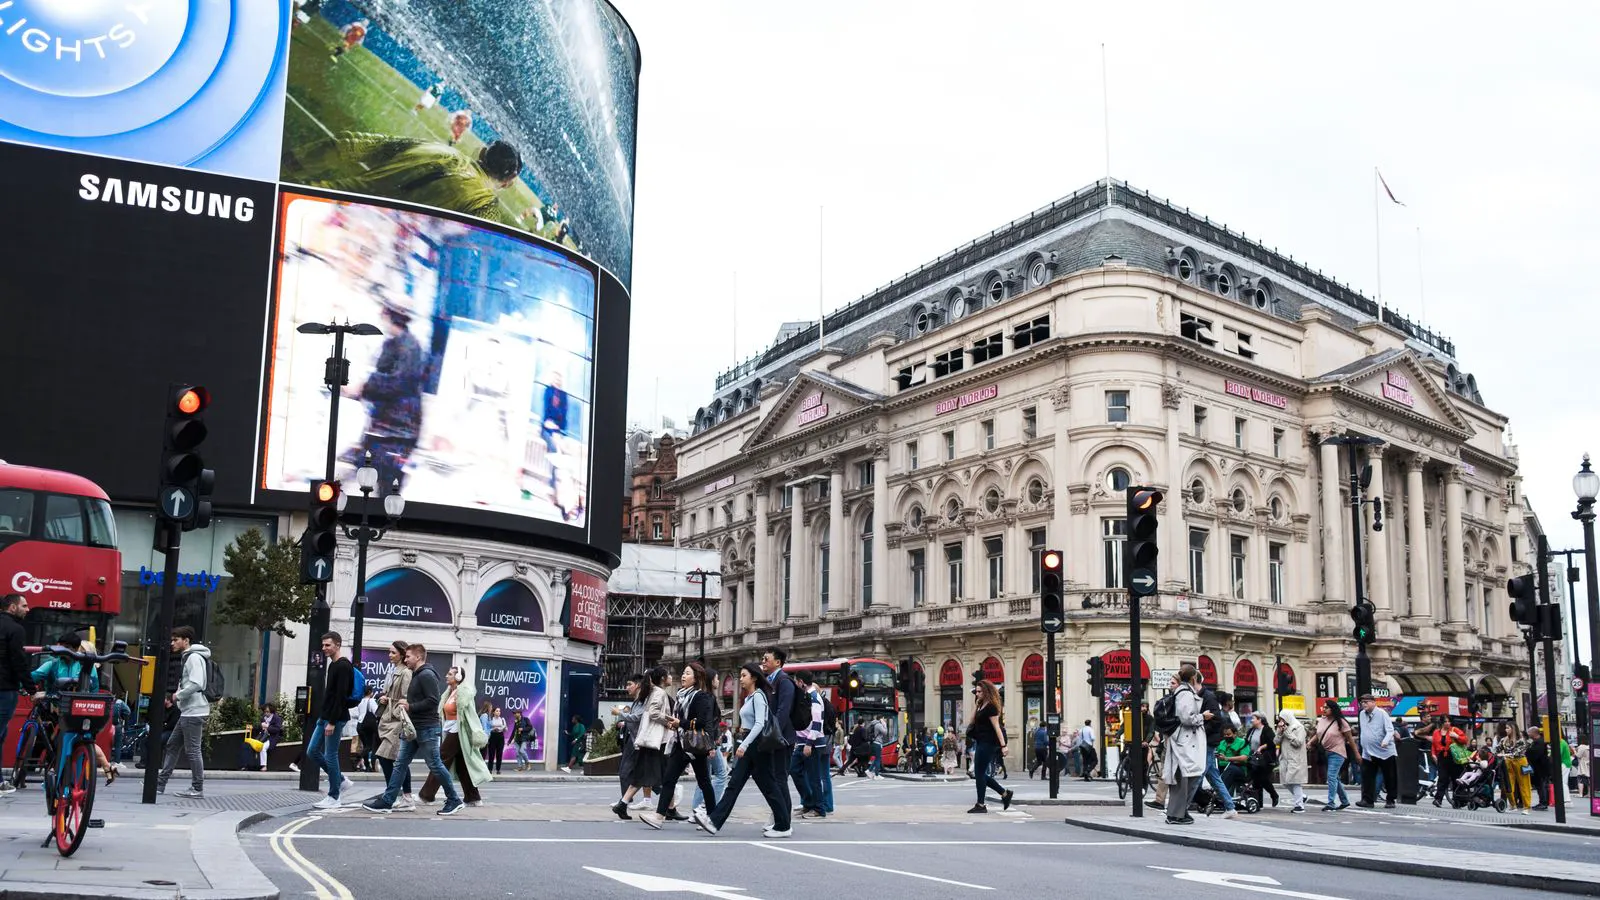
Determine led roi by modeling ad revenue against purchase and operating costs. Focus on high traffic locations where brand visibility drives measurable value. Use conservative estimates for maintenance and content production to build a realistic payback model.
- Build a detailed cost model that separates capital expenditure from ongoing operational expenses.
- Estimate revenue potential using conservative traffic and ad rate assumptions.
- Factor in content production and maintenance costs that often extend the payback period.
- Choose high traffic locations where screen visibility justifies the premium investment.
- Review and adjust your model annually as market rates and technology change.
Why Outdoor LED ROI Differs from Indoor Calculations
Outdoor LED screens face different economic pressures than indoor installations. Weather exposure, power consumption, and content durability affect both the initial led display price and the long term operational budget. A procurement manager evaluating a high traffic location must account for these variables before committing capital.
The core difference lies in revenue generation. Indoor screens often rely on brand awareness or internal communication. Outdoor screens in high traffic areas generate value through direct advertising sales or significant brand visibility. This distinction changes how you structure the payback model and what metrics you track during the first year of operation.
Indoor environments are controlled. Temperature, humidity, and light levels remain stable. The screen is protected by walls and ceilings. This stability lowers the risk of hardware failure and extends the lifespan of components. Outdoor installations sit in the open. They face rain, dust, extreme heat, and freezing temperatures. These elements accelerate wear on electronics and reduce the effective life of the display.
The financial implication is that the initial purchase price of an outdoor screen is rarely the total cost. It is often just the starting point. The structure that holds the screen, the power connection, and the content pipeline form the bulk of the budget. When an indoor buyer looks at a screen, they usually look at the panel. When an outdoor buyer looks at a screen, they must look at the entire asset. The screen is the visible part, but the infrastructure is what keeps it running.
This difference in asset structure changes the risk profile. An indoor screen can be replaced quickly if it fails. The building provides power and mounting points. An outdoor screen failure can leave a large blank space in a public view. The cost of downtime is higher because the opportunity cost of lost advertising revenue is significant.
How to Build a Realistic Cost Model
Start with the capital expenditure. This includes the screen hardware, mounting structure, power connection, and any required civil works. For outdoor installations, the structure and power infrastructure often cost as much as or more than the display itself. A large pixel pitch screen in an exposed location needs reinforced steel and weatherproof cabling. These costs are fixed and should be itemized in your led budgeting worksheet.
Do not underestimate the structural requirements. A screen mounted on a building facade faces different loads than a freestanding structure. Wind loads are a major factor. The wind pressure on a large flat screen can be substantial. Engineers must calculate these forces to ensure the mounting hardware does not fail. If the structure is undersized, you face safety risks and potential legal liability. The cost of a proper engineering assessment is small compared to the cost of a failed structure.
Power connection is another area where costs are often hidden. Standard building wiring may not support the load of a large outdoor display. You may need a dedicated circuit or a new transformer. In remote locations, you might need a generator or a battery backup system. This ensures the screen stays on during power outages. Advertisers value reliability. If the screen goes dark for an hour, you lose revenue and damage your reputation with clients.
Next, model the operational expenses. Power consumption varies by pixel pitch and brightness settings. A high brightness screen running at full brightness for sixteen hours daily draws significantly more power than a lower brightness screen. Include the cost of a backup generator or battery system if power reliability is a concern. Maintenance costs should cover lens cleaning, panel replacement, and routine electrical checks. A typical outdoor screen requires at least two professional service visits per year.
Power consumption is a direct line item. It depends on the number of LEDs lit at any given time. A screen displaying black content uses less power than one displaying white. Content management systems can dim the screen at night and raise the brightness during the day to save energy. This automated control reduces the monthly power bill. When modeling your costs, do not use a flat average. Use a weighted average based on the actual content schedule. If you plan to run the screen twenty four hours a day, the energy cost will be substantial. If you only run it during peak hours, the cost drops.
Maintenance is not just about cleaning the glass. It includes checking the connectors, testing the power distribution units, and inspecting the waterproofing seals. Seals degrade over time. Water ingress can damage the electronics inside the panels. Regular maintenance catches these issues before they become major failures. A small repair today prevents a large panel replacement next month.
Content production is the hidden cost that many buyers underestimate. Outdoor screens need high contrast content that remains visible in daylight. This requires different design standards than indoor content. If you plan to sell the screen to advertisers, you need a creative team or agency that can produce high quality video. If the screen displays your own brand content, budget for annual content refreshes.
Daylight visibility is a technical challenge. The screen must be bright enough to be seen, but not so bright that it causes glare for drivers or pedestrians. The content must have high contrast. Dark backgrounds with bright text work well. Low contrast content fades in the sun. If the content is poor, the screen will look dull and unprofessional. This reduces the value of the advertising slots. High quality content is a feature, not a cost. It justifies higher rates.
Calculating Revenue Potential
The led roi calculation depends on how you monetize the screen. For a standalone advertising screen, revenue comes from selling ad slots to local and regional businesses. The value of each slot depends on foot traffic, vehicle traffic, and the viewer’s purchasing power in that area. A screen on a major highway generates different revenue than a screen in a pedestrian mall, even if both have high visibility.
Highway screens face a different audience. Drivers have short viewing times. The content must be simple and impactful. They cannot read fine print. The message must be clear in seconds. Pedestrian screens allow for longer viewing times. The content can be more detailed. The audience is often in a leisure mode, ready to engage with the message.
The location determines the type of business that will buy space. A screen near an office complex will attract professional services and financial institutions. A screen near a shopping district will attract retail and restaurant chains. A screen near a sports stadium will attract beverage and food brands. Understanding the local economy helps you target the right advertisers. If you sell to the wrong buyers, the ads will not resonate with the audience, and the client will cancel their contract.
For brand owned screens, revenue is harder to quantify. The value comes from increased store visits, app downloads, or customer recognition. You can estimate this by tracking changes in sales or foot traffic before and after the screen installation. Compare the screen’s performance to a similar location without a screen to isolate its impact.
Brand owned screens serve a different purpose. They build familiarity. They keep the brand in the minds of the local population. The revenue is indirect. It shows up as higher store traffic or better brand perception. Measuring this requires careful analysis. You need control groups. You need consistent data collection. Without this, you cannot prove the value to your internal stakeholders.
A practical approach is to use a tiered revenue model. Assign a high value to prime time slots during peak traffic hours. Assign a lower value to off peak hours. This reflects how advertisers actually bid for screen space. If you are selling to third parties, you can observe the market by checking what rates similar screens in the area command. If you are using the screen for internal branding, assign a conservative value based on your marketing budget and the expected lift in customer engagement.
Tiered pricing is standard in the industry. Prime time slots command higher rates. Late night slots are often sold at a discount to fill the inventory. This strategy maximizes revenue. It ensures that the screen is always generating income. It also allows you to test the market. If you lower the price for off peak hours and the slots fill quickly, you can raise the price in the next quarter.
Key Variables That Shift Payback Time
Several factors can move your payback timeline. The first is screen size and pixel pitch. A larger screen with a finer pixel pitch costs more upfront but may command higher advertising rates. However, the energy consumption also increases. You need to balance the initial led display price against the potential revenue lift from a premium format.
Pixel pitch is a technical specification. It refers to the distance between the centers of two LEDs. A smaller pixel pitch means more LEDs per square meter. This results in a sharper image. It allows for smaller text and more detail. However, it also increases the cost of the screen and the power consumption. A large screen with a fine pixel pitch is a premium product. It attracts high end advertisers. A large screen with a coarse pixel pitch is a cost effective product. It is suitable for long distance viewing.
You must match the pixel pitch to the viewing distance. If the screen is viewed from fifty meters away, a fine pixel pitch is unnecessary. The audience cannot see the individual pixels. A coarse pixel pitch is sufficient. It saves money and reduces power consumption. If the screen is viewed from five meters away, a fine pixel pitch is required to display readable text. The wrong choice leads to wasted investment or poor performance.
The second variable is location quality. A screen in a high traffic area with limited advertising inventory commands premium rates. A screen in a saturated market with many competing displays faces price pressure. Assess the competition in the specific area. If there are already three large screens within a half mile, your pricing power drops. If the location is unique, you have more room to charge.
Market saturation is a major risk. If every corner has a screen, the audience becomes desensitized. They stop paying attention. The value of each screen drops. You must analyze the local market before buying. Look for gaps. Look for locations with high traffic but low screen density. These locations offer the best opportunity for premium pricing.
The third variable is technology lifespan. LED screens typically last seven to ten years before major panel replacement is needed. Your led budgeting should account for this. If the screen is a major asset, plan for a replacement fund or a lower initial purchase price that assumes a shorter useful life. This affects the annualized cost and, by extension, the payback period.
The useful life of an outdoor screen is shorter than an indoor screen. The elements degrade the components. The electronics overheat. The seals fail. The structure corrodes. You must plan for these replacements. If you do not, the cost will come out of nowhere. A replacement panel can cost a significant portion of the initial purchase price. Including this in your model ensures a realistic payback period.
| Cost Component | Typical Frequency | Impact on ROI |
|---|---|---|
| Hardware and Installation | One time | Sets the baseline capital cost |
| Power and Connectivity | Monthly | Ongoing operational expense |
| Content Production | Annual or Quarterly | Affects ad quality and viewer retention |
| Maintenance and Repairs | Semi Annual | Unexpected costs can delay payback |
| Insurance and Liability | Annual | Protects against damage and liability claims |
Five Shifts Buyers Should Plan For
First, shift from hardware focus to total cost of ownership. The screen is only one part of the asset. The power connection, structure, and content pipeline determine the true cost. If you buy the cheapest panel that meets the pixel pitch requirement but ignore the power infrastructure, you will face higher long term costs and potential downtime.
Total cost of ownership includes everything. It is the sum of all costs over the life of the asset. It includes the purchase price, installation, power, maintenance, content, and replacement. It gives you a clearer picture of the true value. It helps you compare different options on a level playing field. It prevents you from being fooled by a low initial price.
Second, shift from static revenue to dynamic pricing. Ad rates change with the economy, local events, and competitive pressure. A fixed annual rate model will understate or overstate your revenue. Build a pricing model that allows adjustments each quarter based on actual demand and market conditions.
Dynamic pricing is more complex but more accurate. It reflects the reality of the market. It allows you to capture value when demand is high and attract clients when demand is low. It requires a content management system that supports flexible scheduling. It also requires a sales team that can handle variable rates.
Third, shift from single owner to shared ownership. In some cases, sharing the screen with a local business or municipality reduces the capital burden. This can improve the led roi by lowering the initial investment while maintaining the same traffic benefits. It also adds a layer of operational responsibility that requires clear agreements.
Shared ownership is a viable option for large installations. It spreads the cost across multiple parties. Each party benefits from the screen. It reduces the financial risk for any single owner. However, it requires careful negotiation. You must agree on the split of costs, the split of revenue, and the operational responsibilities. Clear contracts are essential to avoid disputes.
Fourth, shift from visual impact to measurable outcomes. Brand visibility is valuable, but it is difficult to measure. If possible, use QR codes, unique phone numbers, or dedicated landing pages on the screen content. This allows you to track conversions and tie them directly to the screen. Without these tracking mechanisms, you are relying on qualitative impressions, which weaken your business case to internal stakeholders.
Measurable outcomes are key to proving ROI. They provide hard data. They show exactly how the screen is performing. They allow you to optimize the content and the pricing. They make it easier to get budget approvals. They also help you identify the most effective types of content and the most effective time slots.
Fifth, shift from annual review to continuous monitoring. The led display price and the market rates for advertising change. Technology also improves, making older screens less attractive to advertisers. Review your model every year. Update your cost estimates and revenue assumptions. If the payback period stretches beyond your target, consider repurposing the screen or renegotiating ad contracts.
Continuous monitoring is a discipline. It requires regular data collection. It requires regular analysis. It requires a willingness to adjust your strategy. It prevents small issues from becoming big problems. It ensures that your model remains accurate. It keeps your business case strong.
How to Prepare Your Budget for Uncertainty
When building your led budgeting spreadsheet, include a contingency line. This should cover unexpected repairs, power fluctuations, and content redesigns. A conservative estimate is ten to fifteen percent of the annual operating cost. This buffer protects your payback timeline from being derailed by a single major repair or an unexpected increase in energy prices.
Contingency is a standard practice in project management. It acknowledges that things go wrong. It provides a safety net. It allows you to handle emergencies without compromising the core budget. It is a sign of a well planned project. It is a sign of a realistic model.
Also, separate your capital and operational budgets in the proposal. Some internal stakeholders approve capital expenditures quickly but scrutinize operational costs heavily. By presenting them separately, you make it easier to justify the ongoing spend. Show that the operational costs are manageable relative to the revenue potential.
Separating the budgets clarifies the financial picture. It shows what you are spending now and what you are spending later. It helps stakeholders understand the long term commitment. It makes it easier to compare the project against other investments. It also makes it easier to update the budget as conditions change.
Finally, document your assumptions. If you estimate a certain level of foot traffic or a specific advertising rate, explain the basis for that estimate. Reference local market conditions, comparable screen performance, or your own traffic data. Clear documentation makes the model defensible and easier to update when conditions change.
Documentation is essential. It provides a record of your thinking. It allows others to review your work. It helps you identify areas of uncertainty. It makes the model transparent. It builds trust with stakeholders. It is a sign of professional practice.
Frequently asked questions
How long does it typically take for an outdoor LED screen to break even?
Payback periods vary widely based on location, screen size, and revenue model. Many high traffic screens reach break even within two to four years, but some take longer if content costs are high or ad demand is weak.
What is the biggest mistake buyers make when calculating led roi?
The most common error is underestimating operational costs. Buyers often focus on the led display price and ignore power, maintenance, and content production, which significantly extend the payback period.
Can I improve the led roi by choosing a smaller screen?
A smaller screen may have a lower initial cost and lower power consumption. However, it may also generate less revenue. The optimal size depends on the location and the advertising market. A medium sized screen in a high traffic area can outperform a large screen in a low traffic area.
How do I value brand visibility if I am not selling ad space?
Use proxy metrics. Track changes in foot traffic, website visits, or app downloads using unique codes or landing pages linked to the screen content. Compare these metrics to a baseline period or a similar location without a screen to estimate the value of increased visibility.
Should I buy the screen outright or lease it?
Leasing can reduce the upfront capital requirement and may include maintenance. However, it often increases the total cost over the lease term. Compare the total cost of ownership for both options over the expected useful life of the screen before deciding.